Chuck Nicholson1,2, Jeremy Foltz2, Jalyssa Beaudry2 and Shaheer Burney3
1Department of Animal & Dairy Sciences, UW-Madison
2Department of Agricultural & Applied Economics, UW-Madison
3Department of Agricultural Economics, UW-River Falls
Management-intensive grazing emphasizes strategic planning and active monitoring to optimize forage utilization, animal performance, and environmental stewardship. In Wisconsin, grazing continues to receive attention for its potential role in improving economic and environmental outcomes. This research brief summarizes selected findings from a survey of Wisconsin dairy farmers conducted early in 2023, including the characteristics of grazing dairies and their contributions to farm numbers, cows and milk production. As the interest in sustainable farming practices increases, understanding the characteristics of farms using grazing and the potential for additional adoption can be important for future dairy farm management in Wisconsin and other states.
Our team of researchers at the University of Wisconsin-Madison and the University of Wisconsin-River Falls surveyed 2,000 dairy farm owners from January through March 2023. The survey received responses from 688 dairy farm owners for a 34% response rate (see Methods below).
What Proportion Wisconsin Farms Graze?
We identified farms as using grazing if they indicated that they grazed at least some of their animals (lactating cows, dry cows or heifers) with movement of the animals more frequently than every four days. Based on this definition, 18% of respondents were grazers. This proportion of survey respondents is similar to the 22% reported in 2011 by Paine and Gildersleeve[1] based on data from the 2007 Census of Agriculture. Although it is typical to focus on the number of respondents, it is also relevant to evaluate the proportion of cows, land owned, land rented and milk production for grazing farms. Grazing farms surveyed reported owning a total of 8,300 lactating and dry cows, about 6% of the total cows reported by all our survey respondents. Grazing farms responding to the survey owned about 40,000 acres, an amount proportional to their numbers, that is, the average land owned per farm was quite similar for grazing and non-grazing farms. Responding grazing farms also rented about 12,500 acres, which was about 8% of total rented land. Milk production on responding grazing farms totaled about 141 million lbs, comprising about 4% of the total milk production reported by respondents.
Based on the proportion of survey respondents among Wisconsin’s approximately 6,100 dairy farms[2], we estimate that about 1,100 grazing farms own about 74,000 cows and 350,000 acres of land. They are estimated to rent about 111,000 acres of land and contribute about 1.3 billion lbs to Wisconsin’s total milk production of about 32 billion lbs per year.[3] The number of grazing farms appears to have declined in the past 15 years: Paine and Gildersleeve reported more than 3,000 grazing farms in 2007 (although their numbers included all farms practicing ‘rotational or management intensive grazing’ in the 2007 Census of Agriculture). Such a decline in grazing farm numbers appears to be at a similar rate as non-grazing farms.
What are the characteristics of grazing farms compared to non-grazing farms?
One approach to comparing grazing and non-grazing farms is to evaluate average values reported for key variables in our survey. Grazing farms had a smaller average number of cows but similar acres of land owned compared to non-grazing farms (Table 1). The average land rented was considerably lower for grazing farms, as was annual milk production per cow. The rolling herd average reported by our grazing survey respondents (14,712 lbs per cow per year) was somewhat lower than that reported a decade ago by Paine and Gildersleeve (15,430 lbs per cow per year). Non-grazing farms appear to have grown more quickly in the last five years; the average number of cows increased by a smaller percentage for grazing farms than non-grazing farms. Grazing farms reported an increase of 7% in cow numbers since 2018 compared to 16% increase on non-grazing farms. A slightly larger proportion of grazing farms reported having off-farm income than non-grazing farms. Unsurprisingly, a much larger proportion of grazing farms were certified organic, since organic rules require some grazing of animals[4]. A larger proportion of non-grazing farms had an active nutrient management plan and practiced no- or low-tillage farming. Similar proportions of grazing and non-grazing farms used automated milking systems and practiced cover cropping.
Table 1. Characteristics of Grazing and Non-Grazing Farms in 2022
| Farm Characteristic | Grazing | Non-Grazing |
| Milking and dry cows | 72 | 265 |
| Milking and dry cows in 2018 | 67 | 229 |
| Rolling herd average, lbs/cow/year | 14,712 | 21,535 |
| Land owned, acres | 360 | 368 |
| Land rented, acres | 138 | 322 |
| Percentage with non-farm income | 39 | 34 |
| Percentage certified organic | 72 | 11 |
| Percentage with automated milking system | 4 | 6 |
| Percentage with an active nutrient management plan | 46 | 66 |
| Percentage using cover cropping | 11 | 11 |
| Percentage using no- or low-tillage | 46 | 59 |
Source: Survey data analysis
Reporting average values is relevant, but many reported characteristics have considerable variation. Thus, it can be helpful to report the distribution of values and to evaluate how the distribution may be different for grazing farms.
Grazing farms from our survey reported owning fewer milking and dry cows than non-grazing farms. About 50% of grazing respondents indicated they had 50 or fewer cows in 2022, and 84% had fewer than 100 cows (Figure 1). Paine and Gildersleeve reported that in 2007, 66% of grazing farms had fewer than 50 cows, so our value suggests some growth in average grazing farm size over time. A very small proportion of grazing farms had more than 500 cows. In contrast, only about one-quarter of non-grazing farms had fewer than 50 cows, although slightly more than half of respondents had fewer than 100 cows.
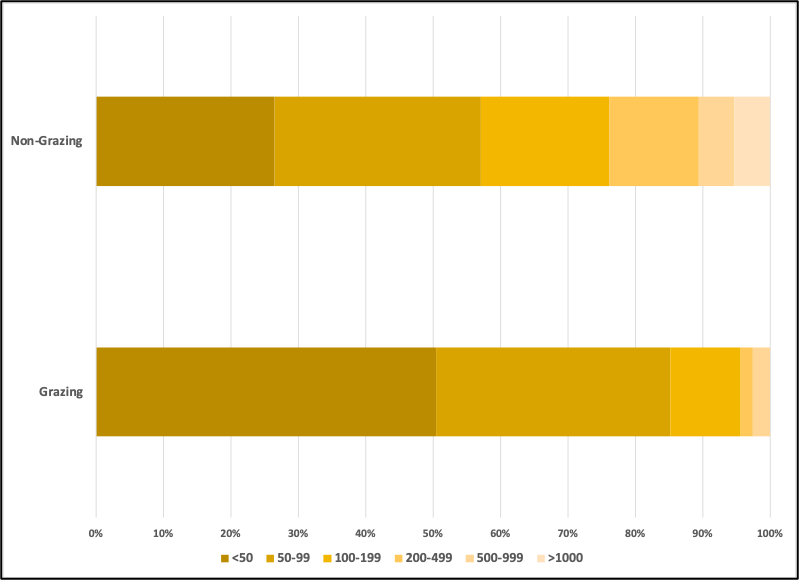
Figure 1. Distribution of Respondents Based on Cow Numbers in 2022, Grazing and Non-Grazing Farms
Note: The distribution is statistically significantly different at p<0.001.
The distribution of reported milk per cow also differs between grazing and non-grazing survey respondents (Figure 2). More than three-quarters of grazing farms reported milk per cow lower than 20,000 lbs per cow per year. In contrast, more than 70% of non-grazing respondents reported milk per cow larger than 20,000 lbs per cow per year. Less than 5% of grazing respondents reported milk per cow above 25,000 lbs per cow per year, whereas 40% of non-grazing respondents indicated this level of cow productivity.
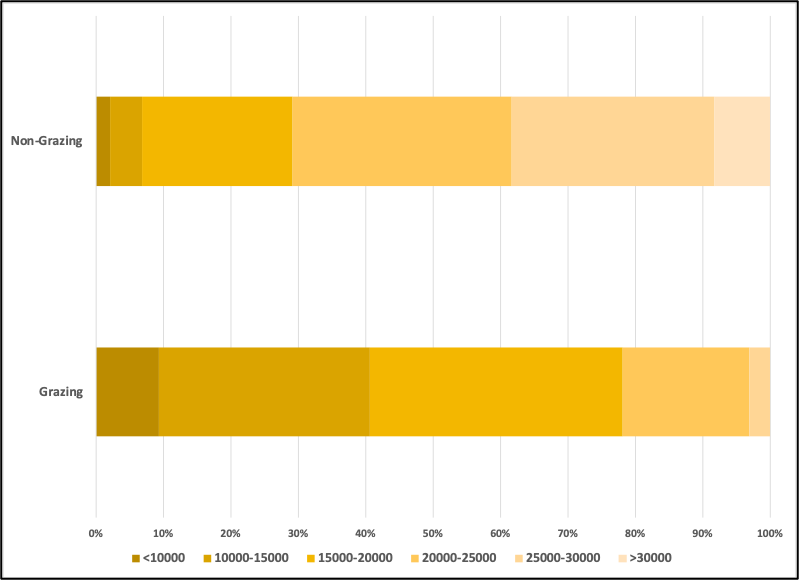
Figure 2. Distribution of Respondents Based on Reported Milk Per Cow in 2022, Grazing and Non-Grazing Farms
Note: The distribution is statistically significantly different between grazing and non-grazing at p<0.001.
In addition to differences in cow numbers and cow productivity, some demographic characteristics differed between grazing and non-grazing respondents. There were a larger number of younger farmers among the grazing respondents than non-grazing farms (Figure 3). Nearly half of grazing respondents were less than 44 years old, whereas only about one-quarter of non-grazing respondents were. Consistent with other studies of farm demographics, more than half of non-grazing farms were 55 years or older.
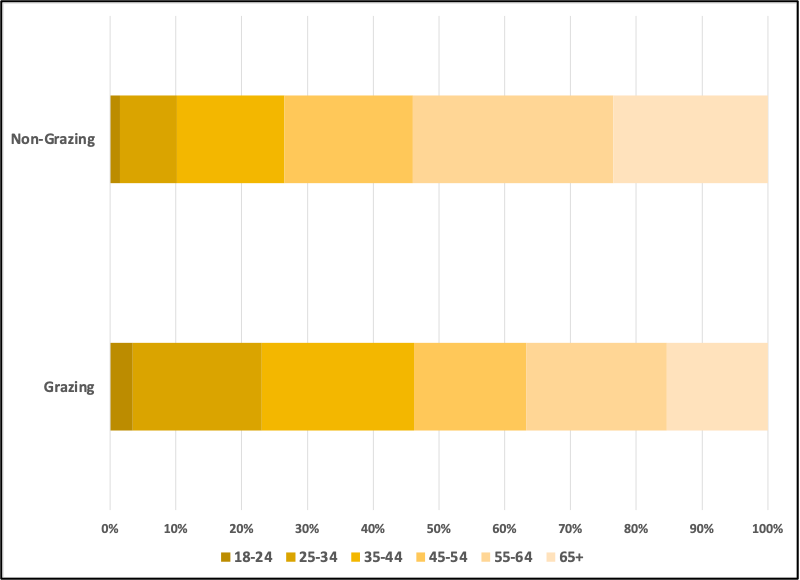
Figure 3. Distribution of Respondent Age, Grazing and Non-Grazing Farms
Note: The distribution is statistically significantly different between grazing and non-grazing at p<0.001.
Previous studies have reported that many farms also generate income from non-farm activities. We evaluated the proportion of farms that reported “significant” non-farm income, and the proportion of total household income from non-farm sources. The pattern for the proportion of income received from non-farm sources was similar for grazing and non-grazing farms (Figure 4). Over 50% of both types of respondents indicated that non-farm income accounted for less than 25% of total household income. A somewhat larger proportion of grazing farms (about one-third) than non-grazing farms reported that non-farm income accounted for between 25 and 50% of total household income.
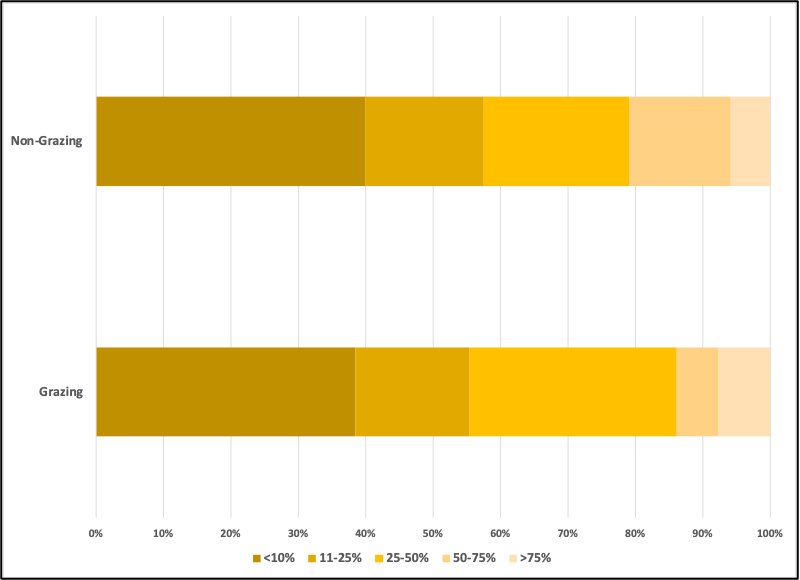
Figure 4. Distribution of the Proportion of Total Household Income that is Non-Farm Income, Grazing and Non-Grazing Farms
Note: The distribution is NOT statistically significantly different between grazing and non-grazing at p<0.10.
To complement the information on non-farm income, we asked respondents to indicate a category for total household income from farm and non-farm sources. As was the case for non-farm income, the pattern for the distribution of total household income was similar for grazing and non-grazing farms. This pattern exists despite the differences in farm size and cow productivity and limited differences in the proportion of non-farm income (Figure 5). About half of each type of respondent reported an income of less than $75,000 per year. A larger proportion of grazing than non-grazing respondents reported incomes between $50,000 and $75,000 per year. Non-grazing respondents more frequently reported total annual household incomes greater than $200,000. Overall, these results suggest that the farm and non-farm activities of grazing and non-grazing farms can result in similar levels of total household income (at least in the 2022 economic context).
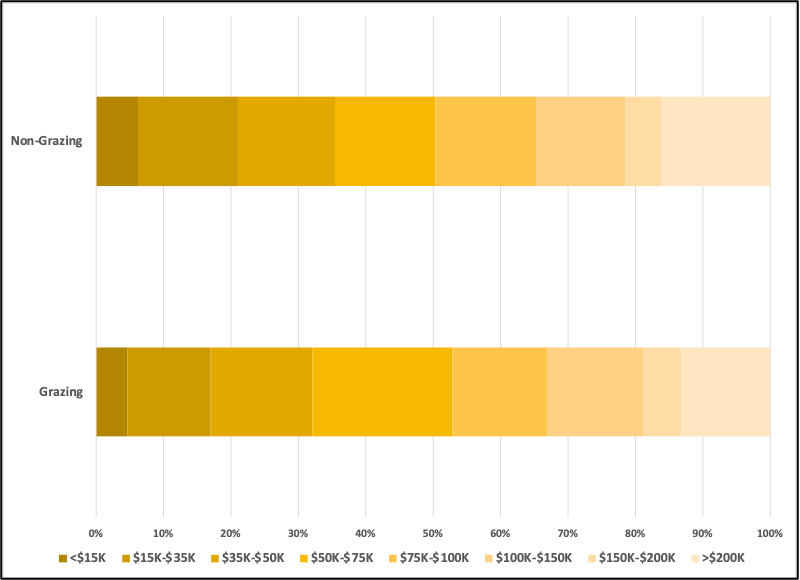
Figure 5. Distribution of the Total Household Income, Grazing and Non-Grazing Farms
Note: The distribution is NOT statistically significantly different between grazing and non-grazing at p<0.10.
Summary
We documented selected contributions of grazing farms to the overall dairy economy and some differences between grazing and non-grazing respondents. We note that although many farm characteristics differ between grazing and non-grazing farms in our survey, the patterns of overall household income were not significantly different. Future outputs from this project will include a detailed analysis of factors that respondents indicated were important supporting or inhibiting factors for the use of grazing, natural resource management, or sustainable agriculture practices.
Acknowledgments
This report is supported by funding from the U.S. Department of Agriculture work was supported by Grassland 2.0, a USDA Sustainable Agriculture Systems grant (#2019- 68012-29852), National Science Foundation Innovations at the Nexus of Food Energy and Water Systems (EAR 1855996), and the University of Wisconsin Sea Grant (NA18, OAR 4170097).
Methods
Between January to March 2023, our research team at the University of Wisconsin conducted three separate surveys distributed via mail to a total of 6,000 dairy farm owners in Wisconsin. For reference, in January 2023 Wisconsin had a total of 6,116 dairy herds. These surveys included a labor and policy survey, a grazing and natural resource management survey, and a survey on automatic milking systems (AMS). Specifically, 2,000 farmers randomly selected from the total population received the policy survey, 2,000 received the grazing practices survey, and 2,000 received the automated milking survey.
Data collection for all three surveys began on January 10, 2023, and was conducted over an approximately 12-week period. Using the Dillman Tailored Design Method, a postcard reminder was sent to non-respondents 3 weeks after the initial mailing, and a second copy of the survey was sent to non-respondents 3 weeks after the postcard reminder. To encourage participation, respondents were offered an incentive in the form of a random draw for one of five $100 cash vouchers. Participants voluntarily provided their names and contact information, which was solely used for selecting draw winners.
The data in these briefs were collected through the grazing and natural resource management survey. We received 688 responses, a response rate of 34%. Our sample size of 688 exceeded the minimum sample size of 362 needed to construct estimates that meet the statistical standard of 5% margin of error and 95% confidence interval.
The grazing and natural resource management survey focused on the use of grazing, natural resource management and sustainable agriculture practices. Additional questions examined the factors supporting or inhibiting the use of those practices. We also collected basic demographic information, including age, education, income, and farm characteristics. To ensure the effectiveness of the survey, questions were rigorously designed by researchers and underwent testing with a select group of farmers who provided valuable feedback.
[1] Laura Paine and Rhonda Gildersleeve. 2011. A Summary of Dairy Grazing Practices in Wisconsin. Center for Integrated Agricultural Systems, University of Wisconsin—Madison. https://cias.wisc.edu/wp-content/uploads/sites/194/2018/05/2011-Dairy-Grazing-Summary.pdf
[2] Includes both Grade A and Grade B production reported by the Wisconsin Department of Agriculture, Trade and Consumer Protection as of January 1, 2023.
[3] Annual milk production value for 2022.
[4] Note that organic grazing rules do not automatically make a farm meet our definition of grazing.